


Shaping the Metropolis: Institutions and Urbanization in the United States and Canada by Zack Taylor
Files
Download Item (193 KB)
Description
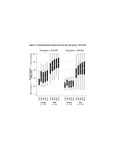
Note: Higher Density Balance Index (DBI) scores indicate more sprawling urban form; lower scores indicate more compact urban form. This box plot shows the distribution of metropolitan DBI scores for each year within each country, separating small and large metros. The top and bottom of the solid bar indicate the metropolitan areas that are at the 25th and 75th percentile. (Half of the metros’ area lies within each bar.) The white line within each bar indicates the median metro. The “whiskers” indicate the tails of the distribution. The box plots indicate that Canadian cities are generally denser than American cities, and have remained so over time, while American cities have become more sprawling over time. It also shows that large cities sprawl less than small ones.
Publication Date
5-5-2019
Sources
Sources: Canada Census, various years, Lopez, “Sprawl in the United States."
Recommended Citation
Taylor, Zack, "Figure 1.4 Density Balance Index scores by city size group, 1970-2010.pdf" (2019). Shaping the Metropolis: Institutions and Urbanization in the United States and Canada by Zack Taylor. 5.
https://ir.lib.uwo.ca/shapingthemetropolis/5