


Shaping the Metropolis: Institutions and Urbanization in the United States and Canada by Zack Taylor
Files
Download Item (220 KB)
Description
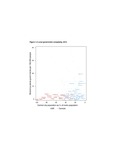
Note: The proportion of the metropolitan area’s population accounted for by the central city (plotted on the x-axis) indicates its relative weight within the region. The number of general-purpose governments (GPGs), not including counties, per 100,000 residents (y-axis) is another measure of government complexity. Less governmentally complex metropolitan areas are therefore found at the bottom left of the graph, while more complex cities are found at the upper right. Nationwide, the average population of metropolitan GPGs is considerably smaller in the United States, while the number of GPGs per 100,000 people is considerably higher. Excluding central cities from these measures reveals a similar relationship. For readability, only cities with more than 300,000 residents are graphed; however, the data in the graph pertain to all U.S. metropolitan statistical areas and Canadian census metropolitan areas and census agglomerations.
Publication Date
5-4-2019
Sources
Sources: Canada from Statistics Canada, Census 2011 Community Profiles; United States populations from 2010 U.S. Census of Population and number of general-purpose municipalities in 2012 from Census of Governments.
Recommended Citation
Taylor, Zack, "Figure 1.3 Local government complexity, 2010.pdf" (2019). Shaping the Metropolis: Institutions and Urbanization in the United States and Canada by Zack Taylor. 4.
https://ir.lib.uwo.ca/shapingthemetropolis/4